Load Tests
Load runs send the same requests as Send, through the same engine, from a separate worker process, and report what happened without averaging it away.
SHA256SUMS. macOS installers are not Developer ID signed or notarized and Windows installers have no code-signing certificate. In-app updates use verified minisign signatures; this does not code-sign the installers. See the preview downloads and Anvil overview.Only Load What You May Load
- Every run needs an explicit acknowledgement. Before starting, Anvil shows the destinations, the planned rate or concurrency and duration, and a reminder that you must own or be authorized to test the target. Start stays disabled until you acknowledge.
- Imported load plans are untrusted and never start automatically.
- An abort rule can stop a run when the failure ratio in a trailing window crosses a threshold; the report is then marked partial.
Pick the Model That Matches the Question
| Workload | How it behaves |
|---|---|
| Open (arrival rate) | Arrivals are scheduled independently of response time. When max_in_flight is reached, an arrival is dropped and counted, never queued, and start lag is measured. |
| Closed (virtual users) | Each user waits for its response before the next iteration, so slower responses lower the rate. These reports never claim a sustained arrival rate. |
| Iterations | A fixed count over a bounded number of lanes. Slower responses lengthen the run instead of dropping work. |
Stages ramp linearly. Each iteration runs a weighted mix or a chain of saved requests, with optional CSV or JSON datasets and a warmup period that is excluded from summary metrics but kept, flagged, in the timeline.
One Protocol, One Unit
Every step of a plan is one call through the same engine path as a manual Send, and produces one unit. What a unit is, and what counts as success, depends on the request's protocol.
| Protocol | One unit is | Success means | Counts reported |
|---|---|---|---|
| HTTP/1.1, HTTP/2, HTTP/3 | One request and its response. Redirects, retries and an HTTP/3 to TCP fallback are attempts inside it. | Status below 400, no SOAP fault or GraphQL error, and assertions pass | Status codes; fallback attempts, requests with a fallback and requests over HTTP/3. A fallback's time is part of the request's latency. |
| Unary gRPC (native over HTTP/2 or HTTP/3, and gRPC-Web) | One call | Status 0 and assertions pass; HTTP 200 alone never counts | Calls by status code, OK and non-OK, and calls with a missing status. A missing status is incomplete, never success. A deadline that elapsed locally is a timeout, never reported as DEADLINE_EXCEEDED. |
| Server-streaming gRPC and gRPC-Web | One stream | The server ended it with status 0, and assertions pass | Streams opened, messages received, streams with messages, time to first message, and the status codes |
| Server-sent events | One stream | A 2xx event stream, and assertions pass | Streams opened, events received, time to first event, and how each stream ended: by the server, by Anvil (the request's event limit), by an idle timeout, or abnormally |
| WebSocket (HTTP/1.1, HTTP/2 or HTTP/3 bootstrap) | One session: the handshake, the request's scripted messages, then the close | Handshake accepted, closed with 1000, 1001 or no code, and assertions pass | Sessions opened, handshakes rejected, sessions not opened, sessions closed cleanly, messages sent and received, and close codes by who closed. Round-trip times only when the request expects replies (expect_messages). |
| TCP, TCP+TLS | One connection carrying the request's frames | Completed, the expected frames arrived (with a framing preset), and assertions pass; fewer frames is an application failure | Connections, frames and payload bytes each way, expected frames met or short, partial trailing frames, and peer closes |
| UDP, DTLS | The request's datagrams, then its response window (for DTLS, after a handshake) | At least one datagram received, and assertions pass | Datagrams sent and datagrams received, as separate counts; exchanges with a response and with no response observed; echoed and repeated payloads; ICMP unreachable; and for DTLS, handshakes attempted, completed, failed and timed out, with their duration |
- A plan measures exactly one kind of unit, so every count, rate and percentile in its report has one denominator. The load editor and
anvil load checkname the unit and its definitions before a run. - A UDP or DTLS exchange with nothing received is “no response observed”: neither a success nor a failure, and it has no latency. A datagram sent is never counted as delivered, and the received-to-sent ratio is labelled an observation, not a delivery rate.
- Connection modes. For HTTP requests and gRPC calls and streams, persistent keeps pooled connections per virtual user (for gRPC, one pooled channel per destination) and fresh opens a connection per unit. SSE streams, WebSocket sessions, TCP exchanges and UDP/DTLS exchanges always open their own connection or socket, and the report says the mode does not apply to them.
- Each unit runs the automation path of its request: the script, stop conditions, idle close and total deadline apply. Commands typed into a live interactive session have no load equivalent.
Checked against the real gateway
The lab's streams profile runs short, low-rate gRPC, WebSocket and UDP load plans through a real Ferrum Edge gateway, on the supported 0.9.8, 0.9.7 and 0.9.5 releases, and compares Anvil's counts with independent ground truth: the backend's own logs and, for gRPC and WebSocket, the gateway's logs.
Refused Before Any Traffic
Combinations without a defined unit are refused when the plan is checked, with a typed reason. The editor shows it and the run cannot start.
| Refused | Why |
|---|---|
| Plans that mix protocols, such as an HTTP login followed by a WebSocket session | Their counts and latencies have different denominators. Split the plan per protocol. |
| Client-streaming and bidirectional gRPC | A long-lived client or two-way stream has no single completion or per-message denominator yet. |
| gRPC with server reflection | Every call would first run a reflection call, so a unit would not be one call. Import the .proto files or a descriptor set instead. |
| SSE with automatic reconnect | Reconnection turns one stream into several connections with server-chosen delays. |
| UDP or DTLS through a CONNECT-UDP (MASQUE) proxy or an HBONE tunnel | Each exchange would open its own QUIC or mTLS connection and tunnel, and there are no tunnel counts. |
| Requests with 0-RTT early data | Handshakes that share session tickets are serialized, and the report has no early-data counts. |
| HTTP or gRPC through an HBONE proxy in persistent mode | Tunnels carry one execution's identity and are never pooled, so persistent mode could not be honoured. Fresh mode is allowed. |
Combinations the engine refuses for any send, such as native gRPC with the HTTP/1.1-only policy or UDP through an HTTP proxy, still fail on each send before any bytes are written. They are local failures in the report, never successes, and an abort rule can stop such a run early.
A Separate Worker, the Same Engine
- Each send is the same call as a manual Send: variables, auth, TLS policy and diagnostics included. HMAC nonces, DPoP proofs and JWT time claims are fresh for every send, and an OAuth token refresh happens once for the whole run.
- The desktop app launches its own executable as the load worker and passes the job over stdin, never the command line or environment. The job carries only the secrets its requests reference.
- Cancel stops scheduling and drains in-flight sends. If the app goes away, the worker stops. If the worker crashes, Anvil rebuilds a partial report from the last progress snapshot and says what is unknown.
- Locking Anvil stops load workers; partial reports are kept.
Reading a Report
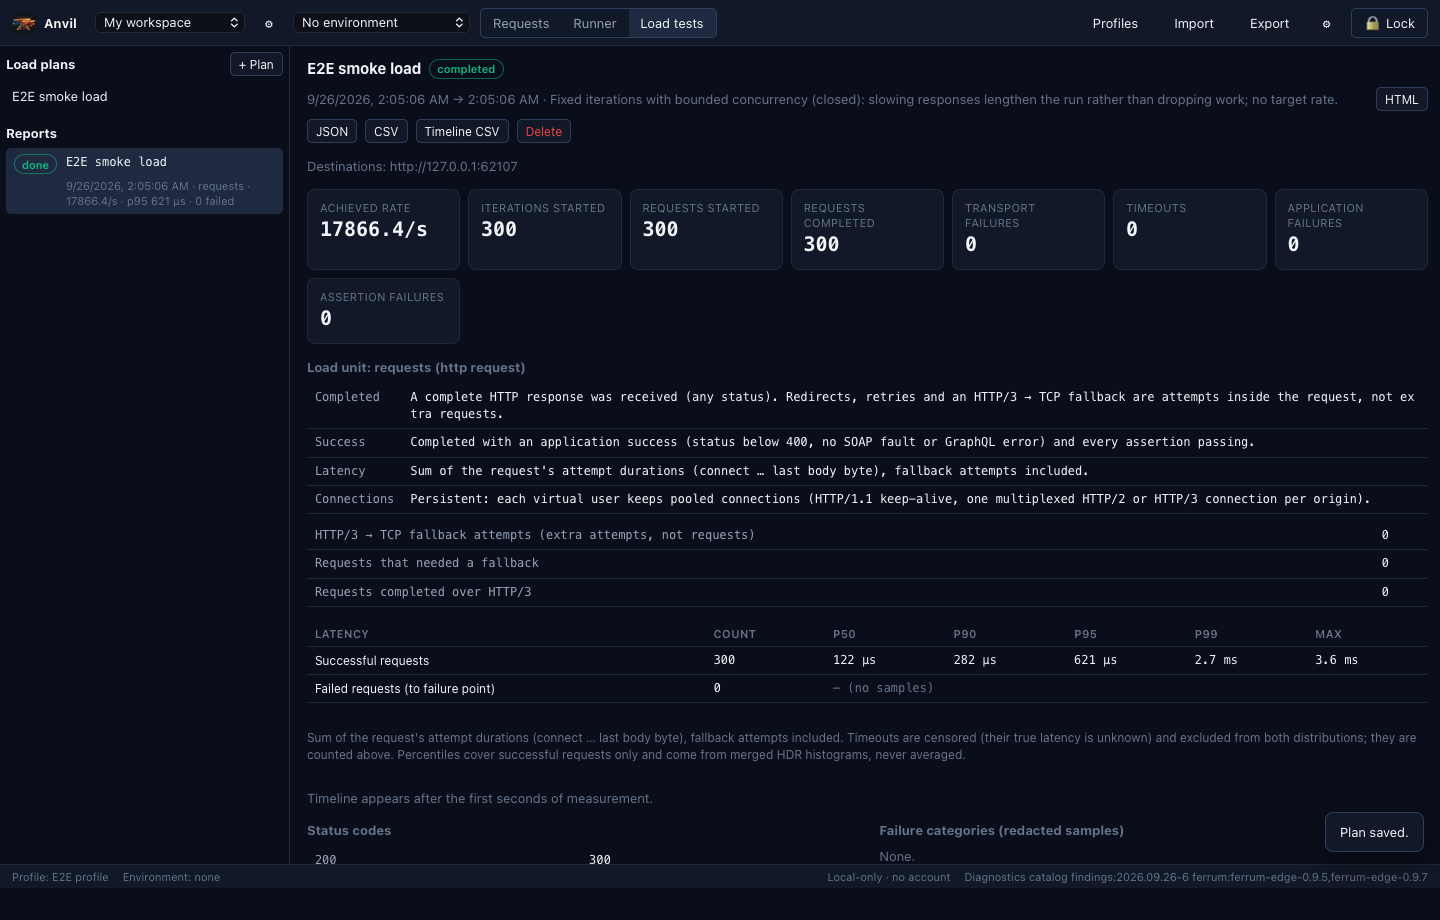
- Balanced counts. Scheduled, dropped, started, completed, failed, timed out, canceled and still-in-flight always add up, for iterations and for units. The protocol counts balance against the unit counts too, and a report that does not balance says so.
- Latency covers connect to last body byte for requests and calls, and until the end for streams and sessions. For UDP and DTLS exchanges it is the time to the first response instead, because an exchange always waits out its response window. Local preparation and token acquisition are reported separately as setup time.
- Timeouts are censored: counted, but kept out of the latency distributions because their true latency is unknown.
- Percentiles come from merged HDR histograms, never from averaged per-worker percentiles. Success and failure latencies are separate.
- A protocol section shows the unit's definitions and its counts, labelled with the unit's own nouns: gRPC status codes with their names, streams and sessions, close codes by who closed, round trips or “not defined”, frames, datagrams and DTLS handshakes.
- Generator health reports the worker's own CPU, memory and descriptors. For open workloads, a run that could not keep its schedule is marked “target not achieved”; that says nothing about the target's capacity. Generator health is unavailable on Windows.
- Failure samples are bounded and built from redacted records, without response bodies.
- Exports: JSON sealed with an integrity hash, CSV guarded against spreadsheet formula injection, and a self-contained HTML report with no scripts.
- Comparison refuses runs of different load units, such as HTTP requests against WebSocket sessions. For the same unit, it withholds latency deltas when two runs are not comparable, for example a different workload model, connection mode or request set, and says why.
What Load Tests Do Not Cover Yet
- The combinations in the refusal table have no load unit yet.
- No load action holds sessions open while sending messages at a rate. A WebSocket unit is connect, scripted messages, close.
- WebSocket round trips pair each scripted message with the reply in the same position, so they fit echo-style exchanges. A session whose reply arrives before its message is counted as unpaired and adds no round trip.
- HTTP/3 with the automatic policy tries QUIC again for every request. Each failed attempt is counted, and its time is part of the request's latency.
- Load through an HBONE tunnel in fresh mode is allowed for TCP-based protocols but has not been exercised under load.
- Message counts per stream or session are reported as totals and means, not percentiles.
- One worker process per run on one machine; no distributed load.
- No JMeter adapter.